


by Brent W. Hubby, on Oct 1, 2022 4:27:37 PM
The popular Intensity Chart just got a new and improved look. But don't panic, the enhancements are subtle. We just wanted you to be aware, so it doesn't catch you off guard.
Gone are the heavy blue headers, footers, and borders. Sure, this will save ink if you print reports, but the real win is in the improved readability.
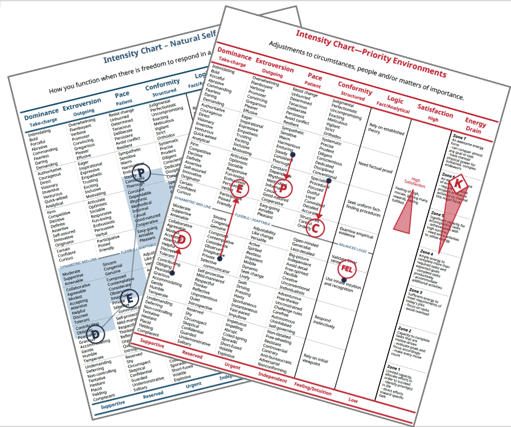
We applied the refreshed look to a terrific new report, the Intensity Chart—Priority Environments.
Overlaying trait adjustments on the intensity chart words will give individuals a better understanding of the pressures they are experiencing.
The new Intensity Chart—Priority Environments will be inserted into the Personal Dynamics Report as page 11 just before the Section 2 narrative description. It will be available as a standalone report too.
The Side-by-Side Reports get to take advantage of the intensity chart enhancements as well. Instead of overlaying a single profile, the Side-by-Side Intensity Chart overlays two profiles, better conveying the similarities and differences between the individuals. The Talking Points at the bottom of each narrative page further the conversation, resulting in more constructive and meaningful relationship-building throughout the Side-by-Side experience.
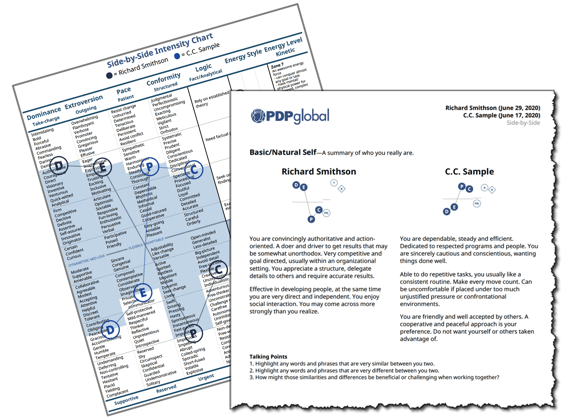
As a reminder, the narrative encourages the individuals to talk through the traits and trait pairs, logic, energy styles and level, communication, leadership, and backup styles. It wraps up with a discussion of differences in perceptions between the two. Then the thinking ahead section helps them both proactively plan and avoid possible future trait behaviors.
Side-by-Side pairing possibilities
|
The Side-by-Side—Pressures report features the addition of the priority intensity chart too. Separate charts to highlight the pressures that each person is experiencing. (We tried combining two individuals on a single intensity chart, but the mix of blue dots, red dots, and stress arrows was too confusing.)
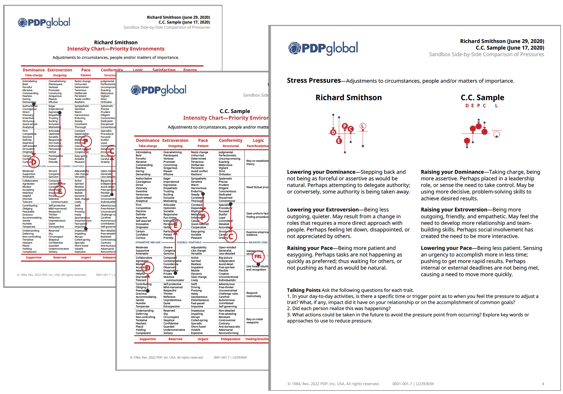
Relationships break down due to misunderstandings about how the other person feels. The narrative descriptions with simplified graphics and talking points create fruitful discussions that zero in on which pressures and challenges may be occurring between the two individuals. Great for conflict resolution! The ultimate goal is to identify, address, and reduce pressures to create a stronger, healthier relationships.
Report Enhancements apply to
|
Updated October 1, 2022
Release | Version 5.0.16497


